Geometry Quality (M1)
The Geometry Quality module computes per-section quality metrics by analyzing the radial deviation between measured and template profiles. It wraps TTunnelDeviationEngine to produce higher-level indices that characterize the excavation precision at each cross-section.
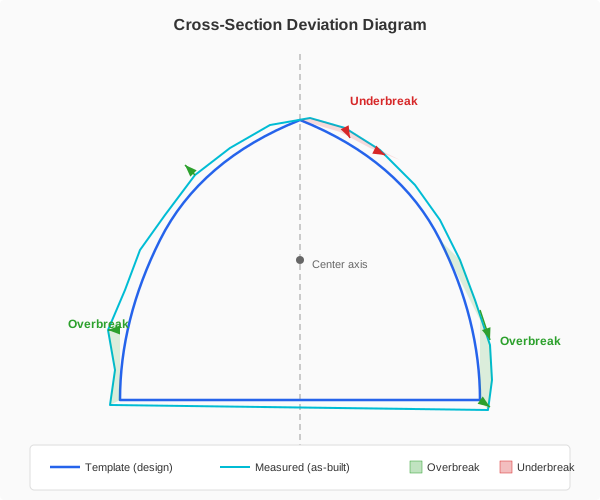
Measured profile (cyan) compared against template profile (blue). Green arrows indicate overbreak (outward deviation); red arrows indicate underbreak (inward deviation).
Computed metrics
For each cross-section, M1 computes the following metrics:
Metric |
Formula |
Unit |
Notes |
|---|---|---|---|
Overbreak Area |
|
m^2^ |
Area of measured profile outside template boundary |
Underbreak Area |
|
m^2^ |
Area of template not excavated – should be zero |
Excavation Ratio |
(A~measured~ / A~template~) x 100 |
% |
Ideal = 100%; values above 100% indicate overbreak |
RMS Deviation |
sqrt(1/n x sum(d~i~^2^)) |
mm |
Root mean square of radial deviations |
Mean Deviation |
(1/n) x sum(d~i~) |
mm |
Positive = systematic overbreak bias |
Max Overbreak |
max(d~i~ > 0) |
mm + position |
Largest outward deviation with world coordinates |
Max Underbreak |
min(d~i~ < 0) |
mm + position |
Critical violation point with world coordinates |
Circularity Index |
4 x pi x A / P^2^ |
0–1 |
1.0 = perfect circle (meaningful for circular designs) |
Irregularity Index |
Variance of d^2^r/d-theta^2^ |
– |
Detects jagged, uncontrolled excavation profiles |
Quality Grade |
Weighted composite |
A/B/C/D |
See grading system below |
Quality Score |
Continuous |
0–100 |
Numeric score within the grade band |
Area metrics
Overbreak and underbreak areas are computed by the deviation engine using polygon clipping between the measured and template profiles. When clip level is enabled, points below the Y-level threshold (relative to the section center) are excluded – this is useful for open-invert sections where the floor is not part of the design profile.
Deviation statistics
Deviations are extracted from the engine’s ComputePointInfos result. Each measured point receives a signed radial distance in millimeters: positive for overbreak (outside template) and negative for underbreak (inside template). The RMS deviation is the primary quality indicator, while the mean deviation reveals systematic bias.
Shape metrics
The Circularity Index measures how close the measured profile is to a perfect circle. For circular tunnel designs, a value near 1.0 indicates uniform excavation. For non-circular designs (horseshoe, D-shape), this metric is less meaningful but still indicates profile regularity.
The Irregularity Index captures the roughness of the excavation surface by computing the variance of the second derivative of the deviation with respect to angle. High values indicate jagged profiles with abrupt local variations, even if the overall RMS is acceptable.
Quality grading system
Each section receives a quality grade from A (excellent) to D (non-compliant) based on the combination of RMS deviation, underbreak area, and excavation ratio.
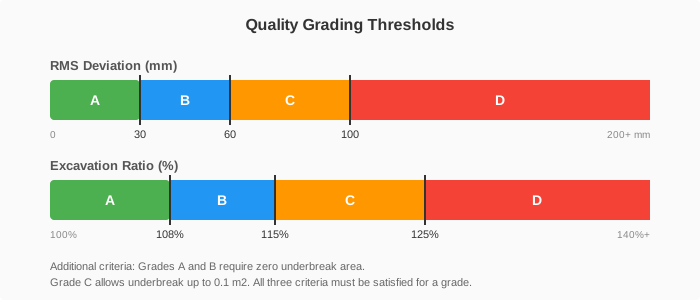
Quality grade thresholds showing the A/B/C/D classification with default RMS and ratio limits.
Grade |
Criteria |
Interpretation |
|---|---|---|
A |
RMS <= 30 mm, Underbreak = 0, Ratio <= 108% |
Excellent – controlled, precise excavation |
B |
RMS <= 60 mm, Underbreak = 0, Ratio <= 115% |
Good – mild overbreak within tolerance |
C |
RMS <= 100 mm, Underbreak <= 0.1 m^2^, Ratio <= 125% |
Acceptable – review recommended |
D |
Any criterion exceeds Grade C limits |
Non-compliant – corrective action required |
Grades are assigned using a waterfall evaluation: the section must satisfy all three criteria for a given grade. If any single criterion fails, the section falls to the next lower grade. Grade D is the catch-all for sections that exceed Grade C limits on any axis.
Quality score
Within each grade band, a continuous numeric score (0–100) provides finer granularity:
Grade A: 90–100 (scaled by how far RMS is below the A threshold)
Grade B: 70–90 (scaled by how far RMS is below the B threshold)
Grade C: 40–70 (scaled by how far RMS is below the C threshold)
Grade D: 0–40 (scaled inversely by how far RMS exceeds 200 mm)
Note
All grade thresholds are configurable per project through the Analytics Configuration dialog. The values shown here are factory defaults. Adjust thresholds to match project specifications or contractual requirements.
Clip level
For tunnels with open inverts (where the floor is not excavated to a designed profile), enabling the clip level excludes measured points below a Y-level threshold from analysis. The clip level is specified as a vertical offset below the section center point.
When clip level is active:
Points below (center Y + clip offset) are excluded from deviation statistics
Area calculations use the engine’s level clipping system
The excluded zone is typically the tunnel floor where no template exists
Tip
Set the clip level to approximately the invert depth (e.g., -2.0 m) to analyze only the arch and walls of an open-invert section. This prevents floor irregularities from skewing the quality metrics.