Mass Table
The Mass Table dialog displays the computed area and volume results for a volume definition across all cross-sections in a tunnel alignment. It is the primary output for quantity estimation and material tracking.
Opening the Mass Table
Open the Mass Table in one of two ways:
From the Volume Definition Editor, click Calculate All or Mass Table.
From the project tree, right-click a volume definition and choose Mass Table.
Grid layout
The grid columns depend on the computation method configured in the volume definition.
Applicable Length method
Column |
Description |
|---|---|
Section |
Section name (with |
Station |
Chainage along the alignment |
Area (m2) |
Computed area at this section |
Appl. L. (m) |
Applicable length – the chainage interval this section represents |
Volume (m3) |
Area multiplied by applicable length |
Cumulative (m3) |
Running total of volume from the first section |
The applicable length for each section is computed as:
First section: half the distance to the next section
Last section: half the distance from the previous section
Middle sections: half the distance between the previous and next sections
This ensures that each section’s influence zone covers exactly the chainage interval it represents, with no gaps or overlaps.
Average Areas method
Column |
Description |
|---|---|
From |
Name of the first section in the pair |
To |
Name of the second section in the pair |
Sta From |
Station of the first section |
Sta To |
Station of the second section |
Avg Area (m2) |
Average of the two sections’ areas |
Distance (m) |
Chainage difference between sections |
Volume (m3) |
Average area multiplied by distance |
Cumulative (m3) |
Running total of volume |
The Average Areas method computes volume for each pair of adjacent sections:
Volume = (Area_i + Area_{i+1}) / 2 * (Station_{i+1} - Station_i)
This method is generally more accurate when the tunnel profile varies significantly between stations, as it accounts for the change in area by averaging.
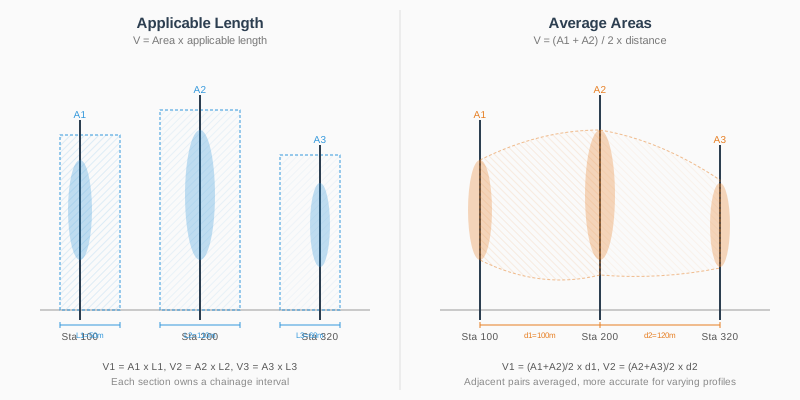
Comparison of Applicable Length (left) and Average Areas (right) volume computation methods across three sections.
Choosing a method
Tip
Average Areas is recommended for most tunnel monitoring workflows, especially when sections are unevenly spaced or the profile changes rapidly. Applicable Length is simpler and sufficient when sections are closely and regularly spaced.
The computation method is set per volume definition in the Volume Definition Editor. You can change the method and recalculate without modifying the formula terms.
Station range
By default, the Mass Table computes volumes across all sections in the alignment. To restrict the range:
Select the Range radio button in the Station Range group.
Enter the From and To station values.
Click Recalculate to update the grid.
Only sections whose station falls within the specified range (inclusive) are included in the computation.
Total row
The last row in the grid shows the TOTAL cumulative volume across all computed sections. This is the primary quantity output for the volume definition.
Warnings
Sections marked with an asterisk (*) after their name encountered evaluation warnings – typically a missing line definition at that station. The area value for such sections may be zero or incomplete. Review these sections to ensure all required line data is present.
Export
CSV export
Click Export CSV to save the mass table as a semicolon-delimited CSV file. The exported file contains the same columns and data as the grid, including the header row and total row.
Excel export
Click Export XLS to save the mass table as an XLSX file (Excel format). The export uses fpspreadsheet and produces a properly formatted workbook with:
Bold header row
Numeric cells for station, area, and volume values (enabling further calculations in Excel)
Text cells for section names
Note
The Excel export produces .xlsx format (Office Open XML). Older .xls format is not supported.
Export to PDF
Export to PDF. Click Export PDF… on the Mass Table dialog (next to Export XLS) to save a printable mass-table report. The PDF starts with a title block (volume name, tunnel, method, station range, generated timestamp + colour swatch) followed by the same grid you see on screen, paginated as needed and topped with a TOTAL row. The final page draws two stacked panels sharing the station X axis: Area (m2) on top, Cumulative Volume (m3) below. The default filename is <TunnelName>_MassTable_<volume-definition>.pdf. Sections that flagged warnings during volume calculation appear with a * next to the section name and a footnote at the table tail explains the marker.