Tolerance Band & Cpk Analysis
The Tolerance module evaluates measured profiles against externally defined project specifications. Given a tolerance band (upper and lower limits), it computes process capability metrics that answer: “Does the profile reliably meet the specification?”
Unlike the Geometry Quality (M1) grading system (which uses internal thresholds) and Clearance & Compliance (M2) checking (which tests for spatial intrusion), tolerance analysis compares deviations against contractual or project specification limits.
Configuration
Enable tolerance analysis in the Analytics Configuration dialog:
Parameter |
Default |
Description |
|---|---|---|
Enable Tolerance Band |
Off |
Master switch for tolerance analysis |
Upper Limit (USL) |
20 mm |
Upper Specification Limit – maximum allowed positive deviation |
Lower Limit (LSL) |
-20 mm |
Lower Specification Limit – maximum allowed negative deviation |
USL and LSL can be asymmetric. For example, a specification might allow +50mm overbreak but only -20mm underbreak:
USL = +50 mm (generous overbreak allowance)
LSL = -20 mm (strict underbreak limit)
When tolerance is disabled, the three tolerance columns in the dashboard grid show - and the tolerance row in the status strip is hidden.
Computed metrics
Tolerance metrics are computed from the existing per-point deviation array (TQualityMetrics.DeviationPoints) – no additional engine calls are needed. Each deviation value is in millimeters, signed (positive = overbreak, negative = underbreak).
Percentage within tolerance (% in Tol)
The most intuitive metric: what fraction of measured points fall within the specification band.
% in Tol = (count of points where LSL <= deviation <= USL) / N x 100
Dashboard color coding:
Value |
Color |
Meaning |
|---|---|---|
>= 95% |
Green |
Excellent specification compliance |
80–95% |
Orange |
Marginal – some points outside tolerance |
< 80% |
Red |
Poor – significant specification violations |
Tip
A section with 100% within tolerance but tight margins (e.g., many points near USL) will show high % in Tol but may have a low Cpk – the Cpk captures the risk that future sections could exceed the limits. Both metrics together give a complete picture.
Process Capability (Cp)
Cp compares the width of the tolerance band to the spread of the process:
Cp = (USL - LSL) / (6 x sigma)
Where sigma is the sample standard deviation of all deviations. The 6-sigma denominator covers approximately 99.7% of a normal distribution.
Interpretation:
Cp value |
Meaning |
|---|---|
> 1.0 |
The process spread (6-sigma) fits within the tolerance band |
= 1.0 |
The spread exactly equals the tolerance – no margin for centering error |
< 1.0 |
The spread is wider than the tolerance – cannot meet spec even if perfectly centered |
Cp measures potential capability only. It ignores whether the process is centered within the tolerance band. A high Cp with a shifted mean will still produce violations on one side.
Process Capability Index (Cpk)
Cpk accounts for both spread AND centering:
CPU = (USL - mean) / (3 x sigma)     <- room on the upper side
CPL = (mean - LSL) / (3 x sigma)     <- room on the lower side
Cpk = min(CPU, CPL)                   <- weakest side governs
The minimum is taken because violations will occur first on whichever side has less room. Cpk is always less than or equal to Cp, with equality only when the mean is exactly at the midpoint of the tolerance band.
Visual explanation:
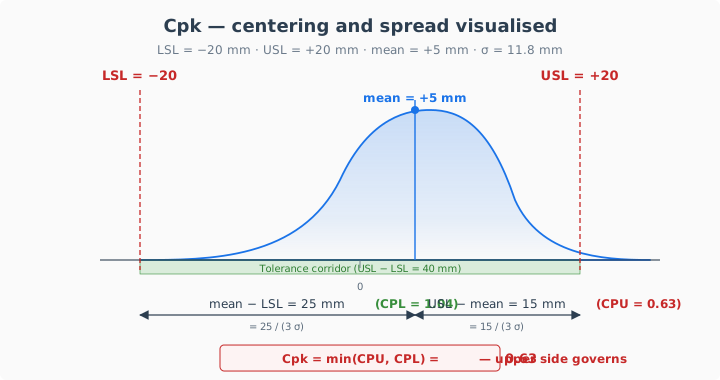
A distribution with mean = +5 mm and σ = 11.8 mm between LSL = −20 mm and USL = +20 mm. The upper side (CPU = 0.63) is tighter than the lower (CPL = 1.04), so Cpk = min(CPU, CPL) = 0.63 — the upper side governs.
In this example the mean is shifted +5 mm toward USL. The upper side (CPU = 0.63) is the weak side and governs the Cpk.
Dashboard color coding:
Cpk value |
Rating |
Color |
Meaning |
|---|---|---|---|
>= 1.33 |
Excellent |
Green |
Comfortably within spec, well centered |
1.00–1.33 |
Capable |
Orange |
Within spec but limited margin |
0.67–1.00 |
Marginal |
Dark orange |
Some exceedances expected |
< 0.67 |
Not Capable |
Red |
Significant specification violations |
Diagnostic use of Cp vs Cpk:
Cp |
Cpk |
Diagnosis |
Action |
|---|---|---|---|
High |
High |
Narrow spread, well centered |
No action needed |
High |
Low |
Spread is fine but mean is shifted |
Correct the systematic bias |
Low |
Low |
Too much scatter |
Improve excavation consistency |
Low |
High |
Impossible – Cpk <= Cp always |
– |
Maximum exceedance
The largest distance any point falls beyond its nearest tolerance limit:
For each point:
  if deviation > USL:  exceedance = deviation - USL
  if deviation < LSL:  exceedance = LSL - deviation
  otherwise:           exceedance = 0

Max Exceedance = maximum of all exceedances
A value of 0 means all points are within tolerance. A value of 12mm means the worst point exceeds the spec by 12mm. The world position of the worst exceedance point is tracked for localization.
Relationship to defect rate
For a normally distributed process, Cpk predicts the expected fraction of points outside tolerance:
Cpk |
Expected % outside tolerance |
Points per 1000 |
|---|---|---|
0.50 |
13.4% |
~134 |
0.67 |
4.6% |
~46 |
1.00 |
0.27% |
~3 |
1.33 |
0.006% |
~0.06 |
1.67 |
0.00006% |
~0.001 |
Note
These defect rates assume a normal (Gaussian) distribution. Tunnel deviations are often skewed (more overbreak than underbreak), so the actual exceedance rate may differ from the theoretical prediction. The % in Tol metric gives the actual observed rate, while Cpk gives a normalized capability index.
Special cases
Cpk = 99.99
All deviation values are identical (zero standard deviation). This typically means the measured and reference lines are the same polyline, or the section has insufficient data. The sentinel value 99.99 indicates “perfect” capability but should be treated as a data quality flag.
Cpk is negative
The mean deviation is outside the specification limits entirely. For example, if mean = +25mm and USL = +20mm:
CPU = (20 - 25) / (3 x sigma) = negative
This indicates a severe systematic deviation where the profile center is already beyond the spec limit. The section requires corrective action regardless of the spread.
Asymmetric tolerances
When USL and LSL have different magnitudes (e.g., USL = +50, LSL = -20), the Cpk naturally handles the asymmetry because CPU and CPL are computed independently. The tighter limit (in this case LSL at -20) will typically be the governing side.
Fewer than 2 points
Standard deviation requires at least 2 points. Sections with 0 or 1 measured points after clipping produce Valid = False and tolerance columns show -.
Visualization
Polar diagram tolerance band
When tolerance is enabled, the polar diagram draws two dashed lines around the reference profile:
Outer dashed line: Reference + USL offset (radially outward)
Inner dashed line: Reference + LSL offset (radially inward)
These form a visible corridor around the design profile. Points of the measured line that fall outside this corridor are exceeding the specification.
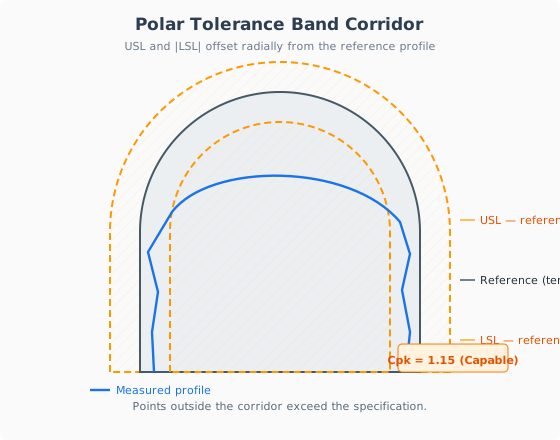
Tolerance corridor on a horseshoe tunnel: the outer dashed orange polyline is the reference offset by USL outward, the inner dashed polyline is the reference offset by |LSL| inward, and the blue measured polyline runs inside the corridor. The Cpk badge in the corner mirrors what the polar diagram shows on screen.
The Cpk value with its rating (e.g., “Cpk: 1.15 (Capable)”) and % within tolerance are displayed at the bottom-right of the diagram.
Status strip tolerance row
The 4th row of the status strip shows tolerance compliance for each section as a colored bar segment:
Color |
Condition |
|---|---|
Green |
>= 95% of points within tolerance |
Orange |
80–95% within tolerance |
Red |
< 80% within tolerance |
Silver |
Tolerance disabled or insufficient data |
Dashboard heatmap — Tolerance mode
The section heatmap panel on the Analytics dashboard has a toggle that cycles Grade → Tolerance → Clearance. In Tolerance mode the cell colour is driven by the corridor compliance of the worst point in that (section × bin):
Colour |
Condition |
|---|---|
Blue |
deviation > USL (overbreak beyond upper limit) |
Red |
deviation < LSL (underbreak beyond lower limit) |
Green |
|
Grey |
no measured point in that bin |
This colour mapping is the inverse of an intuitive “red = bad / green = good” because the colour now carries directional information — reds and blues tell the reviewer which side of the corridor is being violated. The same mapping is used on the Tolerance PDF report’s heatmap page (see Reporting (M6)).
Tolerance PDF report
The standalone Tolerance Report export produces a PDF dedicated to tolerance analysis:
Cover page with the current USL/LSL settings.
Methodology pages (two): a sketch of the corridor width
(USL − LSL)relative to6σ, and a sketch ofCPU / CPL / Cpk = min(...).Tolerance heatmap page with the colour mapping above (blue / red / green / grey).
Per-section sketch pages with dashed orange USL/LSL offset bands and dashed red violation-sector wedges. Sectors where the worst point exceeds tolerance are drawn with a larger wedge so critical ones are visually prominent.
Summary table with per-section % in Tol, Cpk and max exceedance.
See Reporting (M6) for a full description of the PDF page flow and common section-sketch conventions.
Grid columns
Three columns are added to the dashboard grid when tolerance is enabled:
Column |
Width |
Content |
Color coding |
|---|---|---|---|
% in Tol |
50px |
Percentage of points within [LSL, USL] |
Green >= 95%, Orange >= 80%, Red < 80% |
Cpk |
42px |
Process capability index |
Green >= 1.33, Orange >= 1.00, Dk.Orange >= 0.67, Red < 0.67 |
Exceed |
48px |
Maximum exceedance in mm, or |
Plain text |
Exports
XLSX
Three additional columns are appended to the Section Analysis sheet:
Column 14:
% in Tol(number)Column 15:
Cpk(number)Column 16:
Max Exceed (mm)(number)
PDF
The batch table in PDF All reports includes two additional columns:
% Tol: Percentage within toleranceCpk: Process capability index
The single-section PDF includes tolerance information in the polar diagram (tolerance band lines + Cpk text).
Worked example
Specification: +/-20mm tolerance on shotcrete profile
Section at chainage 2+100.000 (150 measured points):
Step |
Computation |
Result |
|---|---|---|
Count within [-20, +20] |
138 of 150 points |
92.0% |
Mean deviation (mu) |
Sum(d_i) / N |
+5.2 mm |
Sample std dev (sigma) |
sqrt(Sum(d_i - mu)^2 / (N-1)) |
11.8 mm |
Cp |
(20 - (-20)) / (6 x 11.8) |
0.56 |
CPU |
(20 - 5.2) / (3 x 11.8) |
0.42 |
CPL |
(5.2 - (-20)) / (3 x 11.8) |
0.71 |
Cpk |
min(0.42, 0.71) |
0.42 (Not Capable) |
Max exceedance |
Worst point at +31mm -> 31-20 |
11 mm |
Interpretation: Both Cp (0.56) and Cpk (0.42) are below 0.67 – the process has too much scatter AND is off-center. The +5.2mm mean bias makes the upper side worse (CPU = 0.42 vs CPL = 0.71). To improve:
Reduce scatter (sigma): Improve excavation/shotcrete consistency to narrow the distribution
Correct bias (mean): Shift the process center toward zero to balance both sides
If only the bias is corrected (mean -> 0), Cpk would improve to Cp = 0.56 – still not capable, so reducing scatter is also necessary
See also
For a detailed mathematical explanation of Cp and Cpk including derivations and defect rate tables, see the specification documents specs/Cpk_Process_Capability_EN.md and specs/Cpk_Process_Capability_GR.md.