Reporting (M6)
The Reporting module provides visualization and export capabilities for all analytics results. It includes the polar deviation diagram renderer, the dashboard summary panel, and export functions for DXF, XLSX, and PDF formats.
Polar deviation diagram
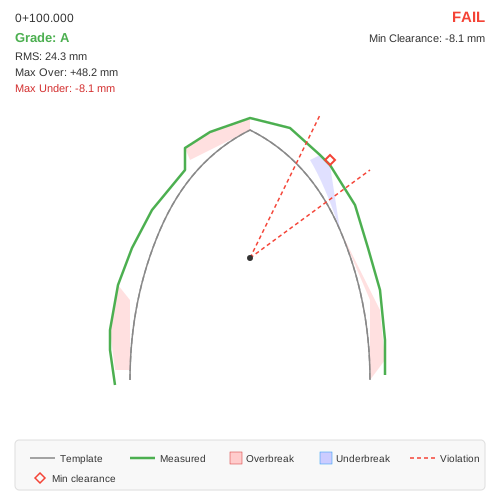
Polar deviation diagram showing the template (gray) and measured (colored) profiles with overbreak (light red) and underbreak (light blue) hatched regions. Violation sector boundaries are drawn as red dashed radial lines.
The polar deviation diagram is the primary per-section visualization. It renders the following elements:
Template profile (gray line): the design boundary
Measured profile (grade-colored line): green for Grade A, orange for B, dark orange for C, red for D
Overbreak regions (light red fill): areas where the measured profile is outside the template
Underbreak regions (light blue fill): areas where the measured profile is inside the template
Violation sector boundaries (red dashed radial lines): drawn at transitions between compliant and violation sectors
Min clearance marker (red diamond): located at the angle of minimum clearance
Tolerance band (dashed lines): USL and LSL offset bands when tolerance is enabled (see Tolerance Band & Cpk Analysis)
Text annotations
The diagram includes text overlays:
Chainage (top-left): formatted as km+meters (e.g., “0+100.000”)
Grade (top-left, colored): quality grade with grade-appropriate color
RMS deviation (top-left): root mean square in mm
Max overbreak (top-left): largest outward deviation in mm
Max underbreak (top-left, if present): largest inward deviation in mm
PASS/FAIL (top-right, bold): overall compliance result (green/red)
Min clearance (top-right): closest approach to the template in mm
Cpk (bottom-right): process capability index with rating, when tolerance is enabled
% in Tol (bottom-right): percentage within tolerance, when tolerance is enabled
Sector visualization
Violation sector boundaries are drawn as red dashed radial lines from the section center to the diagram edge. Lines are drawn only at transitions between violation and non-violation sectors. No-data sectors are treated as transparent – they do not generate boundary lines, preserving the visual contiguity of violation zones.
Dashboard summary panel
The Analytics dashboard grid displays one row per analyzed section with the following columns:
Column |
Content |
|---|---|
Chainage |
Chainage formatted as km+m |
Section |
Section name |
Reference |
Reference line/template name |
Grade |
Quality grade (A/B/C/D) with color background |
RMS (mm) |
RMS deviation |
Max Over |
Maximum overbreak (mm) |
Max Under |
Maximum underbreak (mm), or |
Ratio % |
Excavation ratio |
Over (m^2^) |
Overbreak area |
Clearance |
Minimum clearance (mm), color-coded |
Angle |
Angular position of minimum clearance |
Compliant |
PASS (green) or FAIL (red) |
Violations |
Violation sectors (e.g., |
% in Tol |
Percentage within tolerance (color-coded, see Tolerance Band & Cpk Analysis) |
Cpk |
Process capability index (color-coded) |
Exceed |
Maximum exceedance (mm), or |
Clicking a row updates the polar diagram panel to show that section.
Section heatmap panel
Below the grid, the dashboard carries a section heatmap panel with a (sections × 36 angular bins) grid. The top-right of the panel has a toggle button that cycles through three modes; the currently selected mode is shown next to the button and in the panel title:
Mode |
Cell colour |
Scale |
|---|---|---|
Grade |
Worst absolute deviation of the points falling inside the bin. |
Green → yellow → orange → red, with the same thresholds as the Grade A→D classification. |
Tolerance |
Deviation vs the configured USL/LSL corridor. |
Blue for overbreak beyond USL, red for underbreak beyond LSL, green when inside the tolerance band. |
Clearance |
Per-sector compliance result reused from Clearance & Compliance (M2). |
Two-colour map — green = sector compliant, red = sector has an ssViolation. Grey = no data. |
The Y-axis is labelled Invert / R-Wall / Crown / L-Wall / Invert from bottom to top, matching the walking direction when you step into the tunnel. The X-axis is chainage. Hovering a cell shows a tooltip with the section name, chainage, bin centre angle and the mode-specific value (deviation in mm, % in tolerance, or Pass/Fail/no-data).
The Clearance mode reuses the same sector-violation mapping as the polar diagram and the clearance PDF report, so reds on the heatmap line up one-to-one with red sector wedges on the section sketch. The sector count is driven by the Analytics configuration’s Sector count field (default 24); each heatmap bin’s midpoint angle is mapped into the corresponding sector index.
Polar panel — pan and zoom
The polar deviation panel above the heatmap is interactive:
Mouse wheel — zoom in / out centred on the cursor.
Click-drag — pan.
Double-click — reset to 100% / origin.
The polar rendering is split into two layers: the geometry layer (template, measured, fills, tolerance corridor, violation wedges, clip-level guide) scales with zoom, while the chrome layer (title, chainage, grade, RMS, PASS/FAIL, Cpk badge, legend text) stays anchored to the panel corners. This prevents labels from stretching when the user zooms in on a specific part of the section.
The panel footer shows Zoom N% (wheel zoom · drag pan · dbl-click reset) whenever zoom ≠ 100%.
Status strip
The status strip below the grid provides a tunnel overview with four horizontal bar rows, one colored segment per section:
Row |
Green |
Orange |
Red |
Silver |
|---|---|---|---|---|
Grade |
A |
B |
C, D |
– |
Compliance |
PASS |
– |
FAIL |
– |
Clearance |
>= warning threshold |
0 to threshold |
< 0 (intrusion) |
– |
Tolerance |
>= 95% in tol |
80–95% |
< 80% |
Disabled/no data |
The currently selected section is highlighted with a white border. Clicking a segment selects that section in the grid.
Export formats
XLSX export
Exports a two-sheet Excel workbook via the Export XLSX button:
Sheet 1 – Section Analysis: One row per section with all metrics (station, name, reference, grade, RMS, ratio, areas, max deviations, compliance, violation count, % in tolerance, Cpk, max exceedance). Below the data rows, batch statistics are appended:
Mean and standard deviation of RMS values
Grade distribution counts (how many A/B/C/D sections)
Total overbreak volume (sum of overbreak area x section spacing)
Estimated concrete cost (overbreak volume x unit price)
Sheet 2 – Grading Criteria: The active threshold table showing the configured Grade A/B/C/D limits for RMS, ratio, and underbreak area.
Tip
The XLSX export is well-suited for further analysis in spreadsheet software. Use pivot tables to group sections by grade and summarize metrics by chainage ranges.
DXF export
Exports annotated section drawings via the Export DXF button. One DXF file is created per section with the following layers:
Layer |
Content |
Color |
|---|---|---|
TEMPLATE |
Design polyline |
Gray |
MEASURED |
Measured polyline |
Grade-colored |
OVERBREAK |
Hatched overbreak regions (ANSI31 pattern) |
Red |
UNDERBREAK |
Hatched underbreak regions (ANSI31 rotated) |
Blue |
ANNOTATION |
Chainage, section/template names, grade, RMS, ratio |
White |
SECTORS |
Violation boundary radial lines |
Red |
The DXF files can be opened in any CAD application for further annotation or inclusion in construction drawings.
PDF export
PDF reports are generated via the Export PDF and Export PDF All buttons:
Export PDF: Generates a report for the currently selected section
Export PDF All: Generates a multi-section report with an option to include all sections or only failed (non-compliant) sections
Each section page includes the polar deviation diagram, metrics summary, and compliance status.
Grade report (PDF)
The Grade Report button produces a multi-page PDF focused on geometric quality. It includes:
Cover page with project/tunnel identification and the active grade thresholds.
Summary statistics: grade distribution, mean and standard deviation of RMS, total overbreak volume, estimated concrete cost.
Grade heatmap (sections × bins) using the same colour scale as the dashboard heatmap’s Grade mode. The Y-axis is labelled Invert → R-Wall → Crown → L-Wall → Invert from bottom to top. With View Along Decreasing Chainage on, left and right swap to match the section sketches, and the page is marked “View: decreasing chainage”. The tolerance and clearance heatmap pages use the same rule.
One page per section with the section sketch (template, measured, overbreak/underbreak fills), violation-sector wedges drawn as dashed red radial lines from the section centre, a metrics panel (grade, RMS, max over/under, ratio, area), and, when Y-level clipping is active, a dashed orange horizontal guide line at
Y = ClipLevelDownlabelledY = x.xx m (clip). When the alignment looks toward decreasing chainage, the sketch is mirrored and labelled “View: decreasing chainage” in the top-left of the sketch. The tolerance and clearance section pages use the same label.A PDF-level option to include all sections or only non-compliant ones (grade D, or grade C with issues).
Tolerance report (PDF)
The Tolerance Report button produces a PDF focused exclusively on the tolerance-band analysis (see Tolerance Band & Cpk Analysis). The report drops the Grade/Deviation/Area blocks of the generic report and shows tolerance-only metrics: % in tolerance, Cp, Cpk, max exceedance and per-sector exceedance.
It contains:
Cover page with project/tunnel identification and the current USL/LSL settings.
Methodology pages (two pages) explaining USL/LSL graphically and the Cp/Cpk calculation. Includes a sketch of
(USL − LSL) / 6σand a worked example of theCPU / CPL / min(...)waterfall.Tolerance heatmap page (sections × 36 angular bins). Cells are coloured:
Blue — deviation beyond USL (overbreak outside the corridor);
Red — deviation beyond LSL (underbreak outside the corridor);
Green — deviation within the tolerance band;
Grey — no data in that bin.
The Y-axis labels match the dashboard panel (Invert → R-Wall → Crown → L-Wall → Invert, bottom to top), and the X-axis is chainage.
Per-section pages with the section sketch:
the template (grey) and measured (blue) polylines;
dashed orange USL/LSL offset bands drawn radially outside and inside the template, matching the dashboard corridor;
dashed red violation-sector wedges on sectors whose worst point exceeds the tolerance. Wedges that violate are drawn larger so critical sections stand out;
the clip-level horizontal guide when Y-level clipping is active.
Summary / batch table with one row per section: chainage, % in Tol, Cpk rating, max exceedance.
Clearance report (PDF)
The Clearance Report button generates a dedicated PDF focused on clearance compliance. The report is laid out as:
Summary page with overall statistics (critical section count, minimum clearance, threshold, date, active clip-level setting).
Longitudinal clearance chart — minimum clearance vs chainage with a coloured strip under the plot: red for negative clearance, orange for below threshold, green for compliant.
Clearance heatmap page (new). A
(sections × 36 angular bins)grid coloured:Red — sector fails clearance (ssViolation);
Green — sector passes;
Grey — no data.
This is the same mapping the dashboard uses in Clearance mode, so reds on the heatmap correspond one-to-one with red sector wedges on the per-section sketches later in the report.
Clearance Details table — one row per section with chainage, section name, reference name, minimum clearance, angle of minimum clearance, and PASS/CRITICAL status. When the user selects Critical only at export time, compliant sections are skipped in the table too — not just on the per-section pages.
Per-section pages for the selected sections (all or critical-only). Each page contains:
the section sketch with overbreak (light red) and underbreak (light blue) fills;
dashed red violation-sector wedges for every sector with
ssViolation, drawn the same way as in the grade and tolerance reports, so reviewers can trace heatmap reds directly to the sketch;the minimum-clearance marker (red diamond) at the angle of worst clearance;
the Y-level clip guide — dashed orange horizontal line at
Y = ClipLevelDownwith the labelY = x.xx m (clip), when Y-level clipping was active for the analysis;a right-hand panel with
Min Clearance,At Angle: x.x°,Threshold,STATUS: OK / CRITICAL, andViolation Sectors: k / N.
The angle value in the panel is rendered natively with the ° symbol (DejaVu Sans embedded), so Greek/Unicode section names and degree signs render correctly in both Linux and Windows PDF viewers.
Note
The clearance threshold from the Analytics Configuration determines which sections count as critical. Sections with minimum clearance below the threshold are highlighted in the report and appear in the Critical Only export. The same threshold drives the colour strip of the longitudinal chart.
Common section-sketch features
Grade, Tolerance and Clearance PDF reports share the same per-section sketch conventions:
Template — grey polyline.
Measured — coloured polyline (grade colour for the grade/tolerance reports, blue for clearance).
Overbreak fill — light red polygon.
Underbreak fill — light blue polygon.
Violation-sector wedges — dashed red radial lines from the section centre, closed by a red arc at the outer radius. A wedge is drawn for every sector with
ssViolation. Adjacent violation sectors are merged into a single wedge by skipping the shared radial boundary, so a continuous underbreak arc reads as one zone.Y-level clip guide — dashed orange horizontal line with a
Y = x.xx m (clip)label, drawn only when Y-level clipping was active at analysis time.Tolerance corridor (tolerance report and, when tolerance is on, the grade report) — two dashed orange polylines offset radially outward by USL and inward by
abs(LSL).
Workflow summary
A typical reporting workflow:
Run analysis from the Analytics dashboard
Review the grid and polar diagrams interactively
Export XLSX for the engineering team’s quantitative records
Export PDF All (failed only) for the project compliance file
Export DXF for sections requiring detailed CAD review
Generate a Clearance Report for the structural engineering team