Analytics
The Analytics module provides quantitative analysis of tunnel excavation quality by comparing measured cross-section profiles against theoretical design templates. It transforms raw survey data into actionable engineering metrics – quality grades, compliance reports, trend analysis, and statistical distributions – enabling project teams to identify problems early and document construction quality.
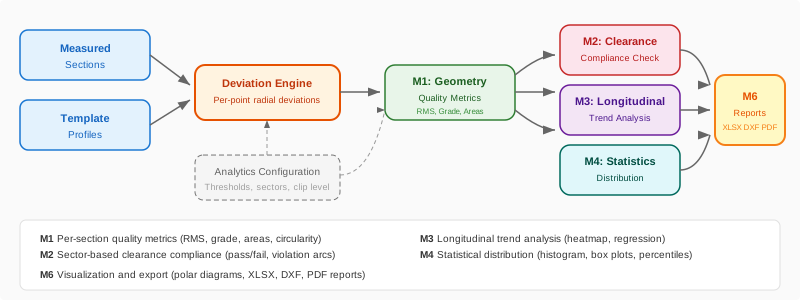
Data flow through the Analytics module: measured sections and templates feed the Deviation Engine, which produces metrics consumed by all sub-modules.
Module overview
The Analytics module is organized into five sub-modules, each addressing a different aspect of excavation quality:
Module |
Name |
Purpose |
|---|---|---|
– |
Analysis modes: Measured vs Template or Measured vs Measured |
|
M1 |
Per-section geometric quality metrics (RMS, areas, grading) |
|
M2 |
Clearance and compliance checking (pass/fail per sector) |
|
– |
Tolerance band analysis: Cpk, % within tolerance, max exceedance |
|
M3 |
Multi-section longitudinal trend analysis and heatmaps |
|
M4 |
Statistical distribution of deviations across sections |
|
M6 |
Visualization, polar diagrams, and export (XLSX, DXF, PDF) |
All analytics sub-modules consume data from TTunnelDeviationEngine, which computes per-point radial deviations between the measured profile and the template at each cross-section. The deviation engine produces a signed distance for every measured point: positive values indicate overbreak (excavation beyond the template) and negative values indicate underbreak (template not fully excavated).
Accessing Analytics
The Analytics dashboard is located on the Analytics tab in the main application window. To run an analysis:
Select an Analysis Mode:
Measured vs Template(compare against design) orMeasured vs Measured(compare two survey lines). See Analysis Modes for details.Select a Measured line (the line definition containing survey data, e.g., “Excavation”)
Select a Reference line (template line or another measured line, depending on the selected mode)
Optionally set a chainage range using the From and To fields
Click Analyze
The dashboard grid populates with per-section results, and clicking any row displays the polar deviation diagram in the panel below.
Active-tunnel synchronisation
The Measured / Reference / From / To controls on the Analytics ribbon are tied to the active tunnel of the current project tab. They are refreshed automatically whenever:
the user switches project tabs (the ribbon re-reads the tab’s active alignment);
the user changes the active tunnel within a project (tree node, load-alignment dialog, etc.) — the frame fires an
OnAlignmentChangednotification and the ribbon re-binds its combos and chainage range to the new tunnel.
The defaults on re-bind are: Measured / Reference → first line definition of the new tunnel, From → StartChainage, To → EndChainage. If the user had typed custom values into From/To while working on a previous tunnel they are replaced — the ribbon always shows values that are valid for the currently active alignment.
Configuration
Analytics thresholds and parameters are configured through the Analytics Configuration dialog, accessible via the Settings button on the Analytics dashboard. All settings are stored per project and saved in the .tun file.
Grade thresholds
These define the boundaries between quality grades A through D:
Parameter |
Default |
Description |
|---|---|---|
Grade A – RMS limit |
30 mm |
Maximum RMS deviation for Grade A |
Grade B – RMS limit |
60 mm |
Maximum RMS deviation for Grade B |
Grade C – RMS limit |
100 mm |
Maximum RMS deviation for Grade C |
Grade A – Ratio limit |
108% |
Maximum excavation ratio for Grade A |
Grade B – Ratio limit |
115% |
Maximum excavation ratio for Grade B |
Grade C – Ratio limit |
125% |
Maximum excavation ratio for Grade C |
Compliance parameters
Parameter |
Default |
Description |
|---|---|---|
Underbreak area maximum |
0.1 m^2^ |
Maximum underbreak area for Grade C (Grade A/B require zero) |
Sector count |
24 |
Number of angular sectors for compliance check (24 = 15 degrees per sector) |
Warning threshold |
10 mm |
Distance below which a sector is flagged as warning rather than compliant |
Fail on warnings |
Off |
When enabled, warning sectors also cause an overall FAIL result |
Clearance threshold |
0 mm |
Sections with minimum clearance below this value are marked as critical |
Area and cost parameters
Parameter |
Default |
Description |
|---|---|---|
Clip level enabled |
Off |
When enabled, points below the clip level are excluded from analysis |
Clip level |
-2.0 m |
Y-offset below section center for level clipping (used for open-invert sections) |
Concrete unit price |
150 EUR/m^3^ |
Unit price for overbreak volume cost estimation in XLSX export |
Tolerance parameters
Parameter |
Default |
Description |
|---|---|---|
Enable Tolerance Band |
Off |
Master switch for tolerance analysis (Cpk, % within tolerance) |
Upper Limit (USL) |
20 mm |
Upper Specification Limit – maximum allowed positive deviation |
Lower Limit (LSL) |
-20 mm |
Lower Specification Limit – maximum allowed negative deviation |
When tolerance is enabled, three additional columns appear in the dashboard grid (% in Tol, Cpk, Exceed), a fourth row appears in the status strip, and the polar diagram shows dashed tolerance band lines. See Tolerance Band & Cpk Analysis for a complete explanation of Cpk and tolerance metrics.
Tip
Click Defaults in the configuration dialog to reset all parameters to factory values. This is useful when starting a new project or when experimenting with different threshold schemes.
Warning
Changing grade thresholds or tolerance limits after analysis invalidates previously computed results. Re-run the analysis after modifying configuration to ensure all sections reflect the updated criteria.